
More than a Consultant.
Advice backed by data competitors can’t replicate.

Recommendations are only as strong as the data behind them.
The gap we see
Typical consulting starts with claims data
Claims data can’t show what happens between prescription and dispense, and it often arrives weeks late. Consulting engagements are also episodic, so insights go stale between projects.
Your team gets recommendations without a clear way to measure whether they worked.
How Claritas Rx closes it
Performance Benchmarking
Performance Benchmarking answers the question every brand team asks: “What does good look like?” It combines directly licensed specialty pharmacy data with aggregated, blinded program metadata to show the patient journey from the day the prescription is written.
| Feature | Typical consulting | Claritas Rx Performance Benchmarking |
|---|---|---|
| Data source | Claims data typically 2-8 weeks old | Directly licensed SP data plus blinded program metadata |
| Visibility | Gaps between prescription and fill | Abandonment and discontinuation reasons claims typically miss |
| Cadence | Episodic engagements | Consulting projects or ongoing tracking |
If you don’t know what good looks like, you can’t get there.
The gap we see
When performance is measured only against itself, or through claims data that lags weeks behind, everyone in the network feels it.
- Commercial & market access leader face decisions built on assumptions, not benchmarks.
- Patient services teams face gaps that surface weeks too late to fix.
- Patients face access barriers that go unseen and unfixed.
 Commercial & market access leader
 Patient services teams
 Patients
How Claritas Rx closes it
Strategic Consulting
Our expert-led engagement measures your brand’s fill rates, time-to-fill, abandonment and persistency against competitors and real-world analogs. Claritas Rx Strategic Consulting uses daily specialty pharmacy and hub data to turn findings into a clear plan for where to act.
- Head-to-head benchmarks that define “good”
- The root cause behind every gap
- Recommendations you can act on and justify
How it works
-
Benchmark
Fill rates and time-to-fill are measured against market competition using exclusive pre-claim SP data and aggregated hub services metadata.
-
Identify
See where your hub is underperforming and where the gaps are widest.
-
Map
Barriers and drop-off points are mapped across the journey to reveal what’s driving abandonment.
-
Define
Our consultants define strategies aligned to top-performing programs and prioritize the interventions that move the KPIs that matter.
Case study
Performance Benchmarking across neurology competitors showed abandonment concentrated in coverage (up to 56%) and enrollment (up to 57%), not affordability.
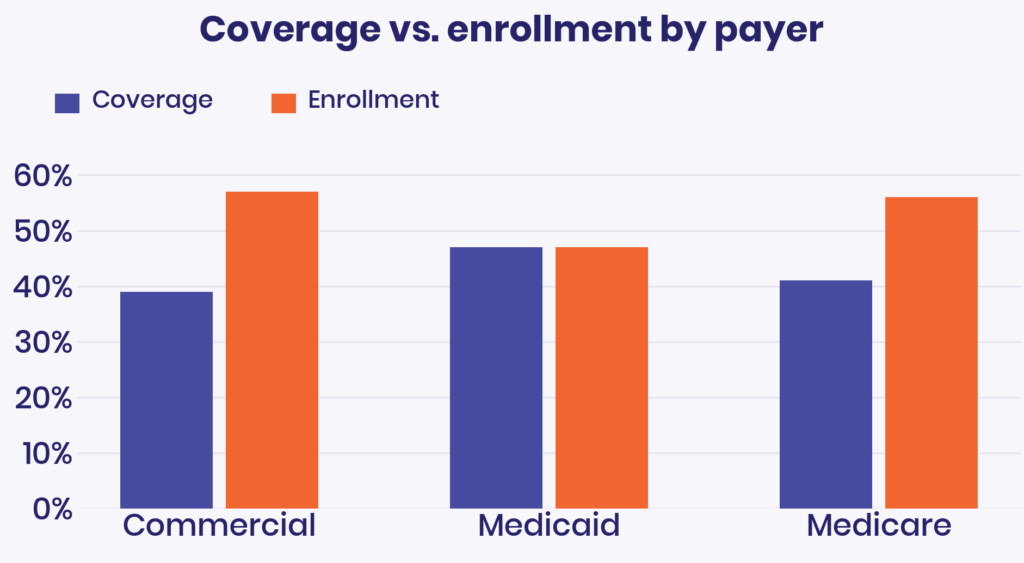
Performance Benchmarking Across Neurology Competitors
Business need: Compare Brand A to competitor brands on fill rate, turnaround time, and persistency — and find where patients leak out of therapy.
Approach
Direct-license SP data reveals real patient behavior and pinpoints therapy initiation barriers through status code analysis.
Results
Brand A (Hub Only) sustains ~40% persistency at Month 12 vs. as low as 6% for competitors. Abandonment is concentrated in coverage (up to 56%) and enrollment (up to 57%), not affordability.
Takeaway
The hub model works — patients stay on therapy far longer. The bigger
opportunity left on the table is fixing coverage delays and enrollment friction, not more patient education.
Ask us about Performance Benchmarking
Discover your new solution for comparing, measuring, and optimizing brand performance in real time.