
The value of AI-powered development tools like Claude Code is real, but for organizations operating in regulated industries — healthcare, biopharma, financial services — the adoption curve presents a familiar tension: innovation velocity versus compliance rigor. The challenge isn’t whether to adopt AI coding tools. Your developers are likely already using them. The question is whether you have visibility into how they’re being used, what data they’re processing, and whether usage patterns align with your organization’s security and compliance requirements.
This article is a practitioner’s walkthrough of how to move from plan-level Claude Code controls to enterprise-grade governance on AWS. You’ll see where Team and Enterprise plan governance stops, why self-hosting model inference on Amazon Bedrock closes those gaps, and how the four resulting upgrades — BAA-covered data residency, a queryable audit trail inside your security tooling, per-invocation IAM attribution, and AWS-native cost attribution — map onto specific HIPAA and SOC 2 obligations. From there we cover the regulated workflows where governance is decisive, a working AWS CDK reference for the logging infrastructure, the developer-side configuration to point Claude Code at Bedrock, and the baseline metrics that prove the program is working within thirty days. Part 2 picks up the real-time client-side telemetry layer that complements this foundation.
Where Built-In Plan Controls Stop
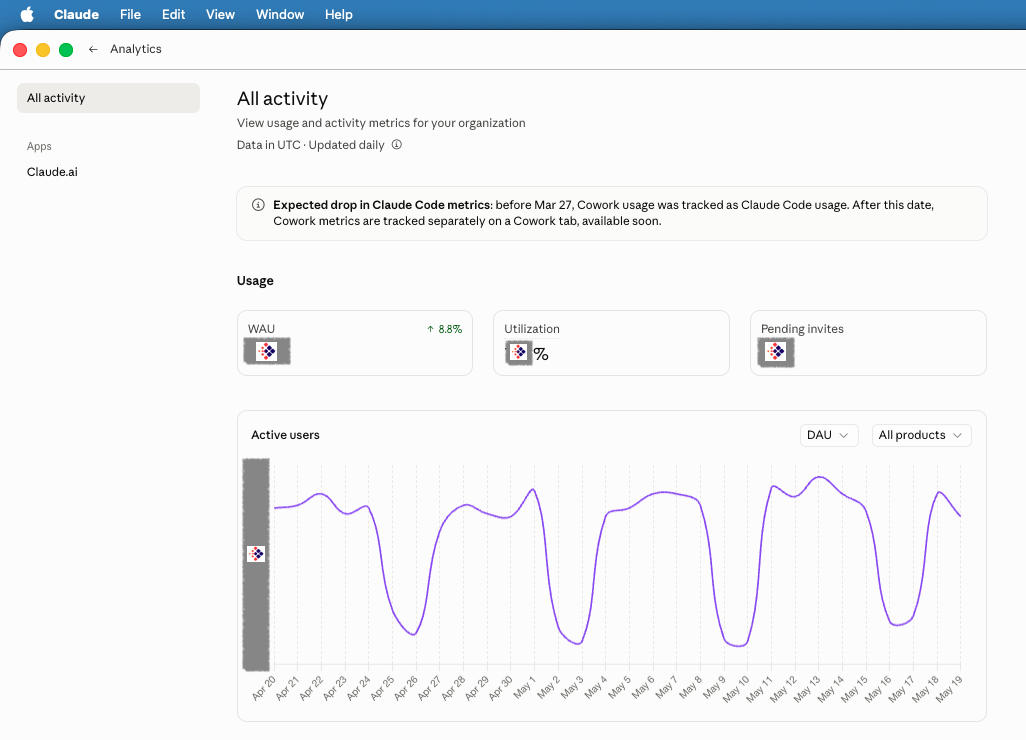
If you’re on a Claude Team or Enterprise plan, you already get a baseline of governance. Admins can manage seats and set spend limits, see usage rollups in the Console, and — on the Enterprise tier — pull activity logs, chat histories, and file content programmatically via the Compliance API.1 For unregulated workloads, that baseline is often enough.
For HIPAA- or SOC 2-bound organizations, it isn’t — and the gaps tend to surface at the worst possible times: during an audit, after an incident, or when legal asks where PHI actually went. Five places where the upgrade from “basic plan visibility” to enterprise-grade governance matters:
- BAA coverage and data residency don’t transfer. AWS’s Business Associate Addendum does not cover Anthropic’s public API; PHI processing on the Claude Developer Platform requires a separate BAA negotiated with Anthropic, and prompts traverse Anthropic’s hosted infrastructure rather than your AWS environment.2 For organizations whose customer contracts or regulators require data to stay inside their cloud boundary, this alone is decisive.
- The audit trail isn’t queryable in your security tooling. The Compliance API gives you the data; it doesn’t give you a SIEM-joined, IAM-attributed log group that your security and SRE teams already operate against. Building that pipeline is real engineering work — and agentic surfaces such as Cowork are not yet covered by the Compliance API or audit logs at all.1
- User attribution is plan-account-level, not IAM-principal-level. You can see which Claude account did something. You don’t have an IAM ARN tied to your corporate identity provider, MFA state, and session policy on every request — which is what an incident responder needs to scope blast radius.
- Cost attribution doesn’t roll up by team, project, or cost center natively. AI spend lands on a corporate card or a single Claude bill, not in the AWS Cost Explorer breakdown your finance org already uses for the rest of the cloud estate.
- Data exposure detection is your problem. Even with logs in hand, identifying that a developer pasted member IDs, prescriber NPIs, or diagnosis codes into a prompt requires DLP scanning over the prompt text — something the Compliance API surfaces but doesn’t automate.
The first item is the decision-driver. The other four are tractable engineering problems — but they’re all problems you no longer have to solve once inference moves into your AWS account.
Self-Hosting on Bedrock: From Plan Controls to Enterprise Governance
The architectural decision that closes the gap is to bring model inference inside your AWS environment via Amazon Bedrock. Rather than routing requests through Anthropic’s hosted infrastructure, your developers authenticate via AWS IAM Identity Center (formerly AWS SSO) and invoke the same Claude models (Opus, Sonnet, Haiku) through Bedrock endpoints in your own AWS account. Claude Code supports this natively — setting CLAUDE_CODE_USE_BEDROCK=1 along with AWS_REGION routes the CLI through Bedrock without changing the developer workflow.3
This single change unlocks four upgrades over plan-level controls. The first is the one that carries the decision for most regulated organizations; the rest follow.
1. Data Residency and BAA Coverage — The Decision-Driver
For regulated workloads, this is the pillar that flips the conversation with security and compliance leadership from “interesting” to “approved.” Model inference happens entirely within your AWS environment, under your account, in the regions you choose, governed by the same controls that already cover your protected data.
- AWS BAA coverage. Amazon Bedrock is a HIPAA-eligible service under your existing AWS Business Associate Addendum, so PHI processing is contractually protected without negotiating a separate BAA with another vendor.2 This is the contractual difference from Anthropic’s public API, where BAA coverage requires a direct agreement with Anthropic.
- No data leaves your network boundary. Prompts containing claims data, member identifiers, or proprietary business logic stay inside your VPC and your AWS account. There is no third-party hop, no shared multi-tenant inference plane outside your control. When using Claude on Bedrock, Anthropic does not have access to your prompts, responses, or logs.4
- Regional deployment for GDPR, HIPAA, and contractual residency requirements. You choose the AWS Region — and Bedrock invokes the model there.
- VPC endpoint isolation for sensitive workloads. PrivateLink interface endpoints for the
bedrockandbedrock-runtimeservices let Bedrock traffic stay off the public internet, with no internet gateway, NAT device, VPN, or Direct Connect required.5
For organizations whose customer contracts, regulatory obligations, or internal data governance policies say “your data does not leave our environment,” Bedrock is often the only path that lets developers use frontier AI tools without violating those commitments. The other three pillars below are valuable; this is the one that makes Claude Code adoption legally possible in regulated settings at all.
2. A Queryable Audit Trail Inside Your Security Tooling
The Compliance API gives you the data. Bedrock gives you the data in the place your security and SRE teams already operate. Every model invocation — prompt, response, metadata, user identity — can be logged to S3 and CloudWatch Logs in your account.6 The Bedrock console now ships a pre-configured CloudWatch automatic dashboard with an invocation table where you can drill into any individual request and choose “View in Logs Insights” to inspect the actual prompt and response.7 Reviewing AI conversations is a few clicks away in the same console your SREs and security engineers already use — not a custom export pipeline you have to build and maintain.
That changes what’s possible operationally:
- Auditors can be answered in minutes, not weeks. An accessible trail, queryable by user, time, model, and content, satisfies what SOC 2 CC7 (system operations) and HIPAA §164.312(b) (audit controls) ask for: evidence that you can detect, review, and investigate access to systems handling sensitive data.8,9
- Agent decisions are replayable. When an agent takes an unexpected action — a destructive tool call, an off-policy data access, a wrong recommendation that made it into production — root-cause analysis depends on being able to replay exactly what the model was told and what it produced. Bedrock invocation logs give you that fidelity natively.
- DLP scanning runs against a real log group. Pattern detection for PHI, secrets, or proprietary identifiers can run against CloudWatch Logs directly, using the same tooling that already covers the rest of your estate.
3. Per-Invocation IAM Attribution
This is the upgrade that matters most for incident response. Every Bedrock request carries the calling IAM principal’s ARN — not a plan-level account, but the same identity your corporate IdP, MFA policies, and session controls already govern. That gives you:
- Per-request user attribution. Every invocation in the log is tied to a specific IAM identity, joinable with the rest of your CloudTrail and access-log data.
- Time-limited sessions and MFA enforcement. SSO sessions (e.g., 12-hour tokens) replace long-lived API keys; MFA can be required for sensitive operations.
- Fine-grained policies by team, project, or model tier. IAM policies can restrict who can invoke which models, in which regions, from which networks — the same policy primitives you already use everywhere else.
The result: when an incident responder asks “who did this and what session were they in,” the answer is in CloudTrail and the Bedrock log, not in a separate Claude admin console.
4. Cost Visibility and Attribution
AI spend joins the rest of your cloud bill. Native AWS Cost Explorer integration provides:
- Usage by developer, team, or cost center
- Token consumption trends by model tier
- Budget alerts to prevent runaway spending
This is the smallest upgrade of the four, but it’s the one that puts AI spend on the same governance surface as the rest of the infrastructure budget — which is usually a prerequisite for finance and engineering leadership to plan around it together.

Real-World Use Cases Where Governance Matters
The value of AI governance becomes concrete when you consider specific workflows in regulated operations.
Use Case 1: PHI-Adjacent Development
A data engineer builds an AWS Glue ETL pipeline that transforms claims data from payers into a standardized schema. During development, they use Claude Code to debug a PySpark join condition. With Bedrock logging enabled, your security team can:
- Review whether the developer shared actual PHI in prompts (vs. synthetic test data)
- Validate that AI-generated code adheres to data masking policies
- Audit the full development history if the pipeline is later flagged in a compliance review
Without governance: the developer’s interaction with AI is invisible. If PHI exposure occurred, there’s no detection mechanism.
With governance: logs capture the prompt, the response, and the user identity. Automated DLP scanning can flag suspicious patterns for review.
Use Case 2: Vendor Onboarding and Data Exchange
Your organization integrates with a new PBM partner, requiring development of secure data exchange pipelines. Engineers use Claude Code to accelerate API integration work, generate data validation scripts, and troubleshoot authentication flows. Bedrock logging provides:
- Adoption metrics: which teams adopted AI tools during the integration sprint? How did usage correlate with delivery velocity?
- Quality assurance: did developers use Claude to review security implications of API key handling or credential rotation?
- Intellectual property protection: confirm that proprietary integration patterns or business logic weren’t inadvertently shared with external AI services.
Use Case 3: Incident Response and Agent Root-Cause Analysis
At 3 AM, a production data pipeline fails, halting claim submissions to a major payer. Your on-call engineer uses Claude Code to analyze CloudWatch logs, interpret error messages, and generate a hotfix. Post-incident, leadership wants to understand:
- How did AI assistance affect mean time to resolution (MTTR)?
- Did the engineer’s prompts expose sensitive operational details?
- If an autonomous agent made a tool call that contributed to the incident, exactly what was the model told, what did it decide to do, and why?
- Can we standardize AI-assisted incident response patterns?
That last question is where transparency really pays off. Agentic systems make decisions you didn’t directly write — when one of them does something unexpected in production, your ability to debug it depends entirely on having the conversation, the tool inputs, and the tool outputs available to replay. Bedrock invocation logs give you that fidelity, joined with CloudWatch metrics, in the same console you already use for incident response.
CloudWatch Logs Insights queries can answer the operational questions in minutes:
-- Find all Bedrock invocations during incident window
fields @timestamp, identity.arn, modelId, usage.inputTokens
| filter @timestamp >= '2026-03-15T03:00:00Z' and @timestamp <= '2026-03-15T04:30:00Z'
| stats count() as invocations, sum(usage.inputTokens) as total_tokens by identity.arn
Use Case 4: Regulatory Audit Readiness
A HIPAA audit includes the question: “How do you ensure AI tools used in application development don’t result in unauthorized PHI disclosure?” With Bedrock self-hosting, you demonstrate:
- Technical controls: all AI invocations logged with retention aligned to your audit policy (e.g., 1 year for production), satisfying audit trail requirements
- Access controls: IAM policies restrict Bedrock usage to authorized developers with MFA
- Data protection: your AWS BAA covers Bedrock for PHI processing; data never transits external networks
- Monitoring: automated alerts trigger when token usage spikes (potential bulk data exposure)
The audit finding: “Compliant. Organization has implemented comprehensive logging and access controls for AI development tools.”
Implementation: Simpler Than You Think
Standing up Bedrock-backed Claude Code requires four components.
1. Logging Infrastructure (AWS CDK)
An S3 bucket for durable log storage, a CloudWatch Logs group for real-time analysis, and an IAM role allowing Bedrock to write logs:
const bedrockLogsBucket = new Bucket(this, 'BedrockLogsBucket', {
  bucketName: `my-org-bedrock-logs`,
  versioned: true,
  encryption: BucketEncryption.S3_MANAGED,
  blockPublicAccess: BlockPublicAccess.BLOCK_ALL
});

const bedrockLogGroup = new LogGroup(this, 'BedrockLogsLogGroup', {
  logGroupName: `/aws/bedrock/modelinvocations`,
  retention: RetentionDays.ONE_YEAR
});
2. Bedrock Logging Configuration
Native CloudFormation does not currently expose model invocation logging as a managed resource type, so most production deployments use a Lambda-backed Custom Resource (or Terraform / Pulumi providers, which wrap the underlying Bedrock API).10 The Custom Resource calls PutModelInvocationLoggingConfiguration with a shape like:
const loggingConfig = {
  loggingConfig: {
    cloudWatchConfig: {
      logGroupName: props.LogGroupName,
      roleArn: props.RoleArn,
      largeDataDeliveryS3Config: {
        bucketName: props.S3BucketName,
        keyPrefix: 'large-data/'
      }
    },
    s3Config: {
      bucketName: props.S3BucketName,
      keyPrefix: 'model-invocations/'
    },
    textDataDeliveryEnabled: true,
    imageDataDeliveryEnabled: true,
    embeddingDataDeliveryEnabled: true
  }
};
3. Usage Dashboard (AWS CDK)
Once logging is in place, a CloudWatch dashboard turns raw invocation data into an operational view that engineering, finance, and compliance can share. The CDK Dashboard construct lets you define this as code — versioned, reviewable, and deployed alongside the logging infrastructure.
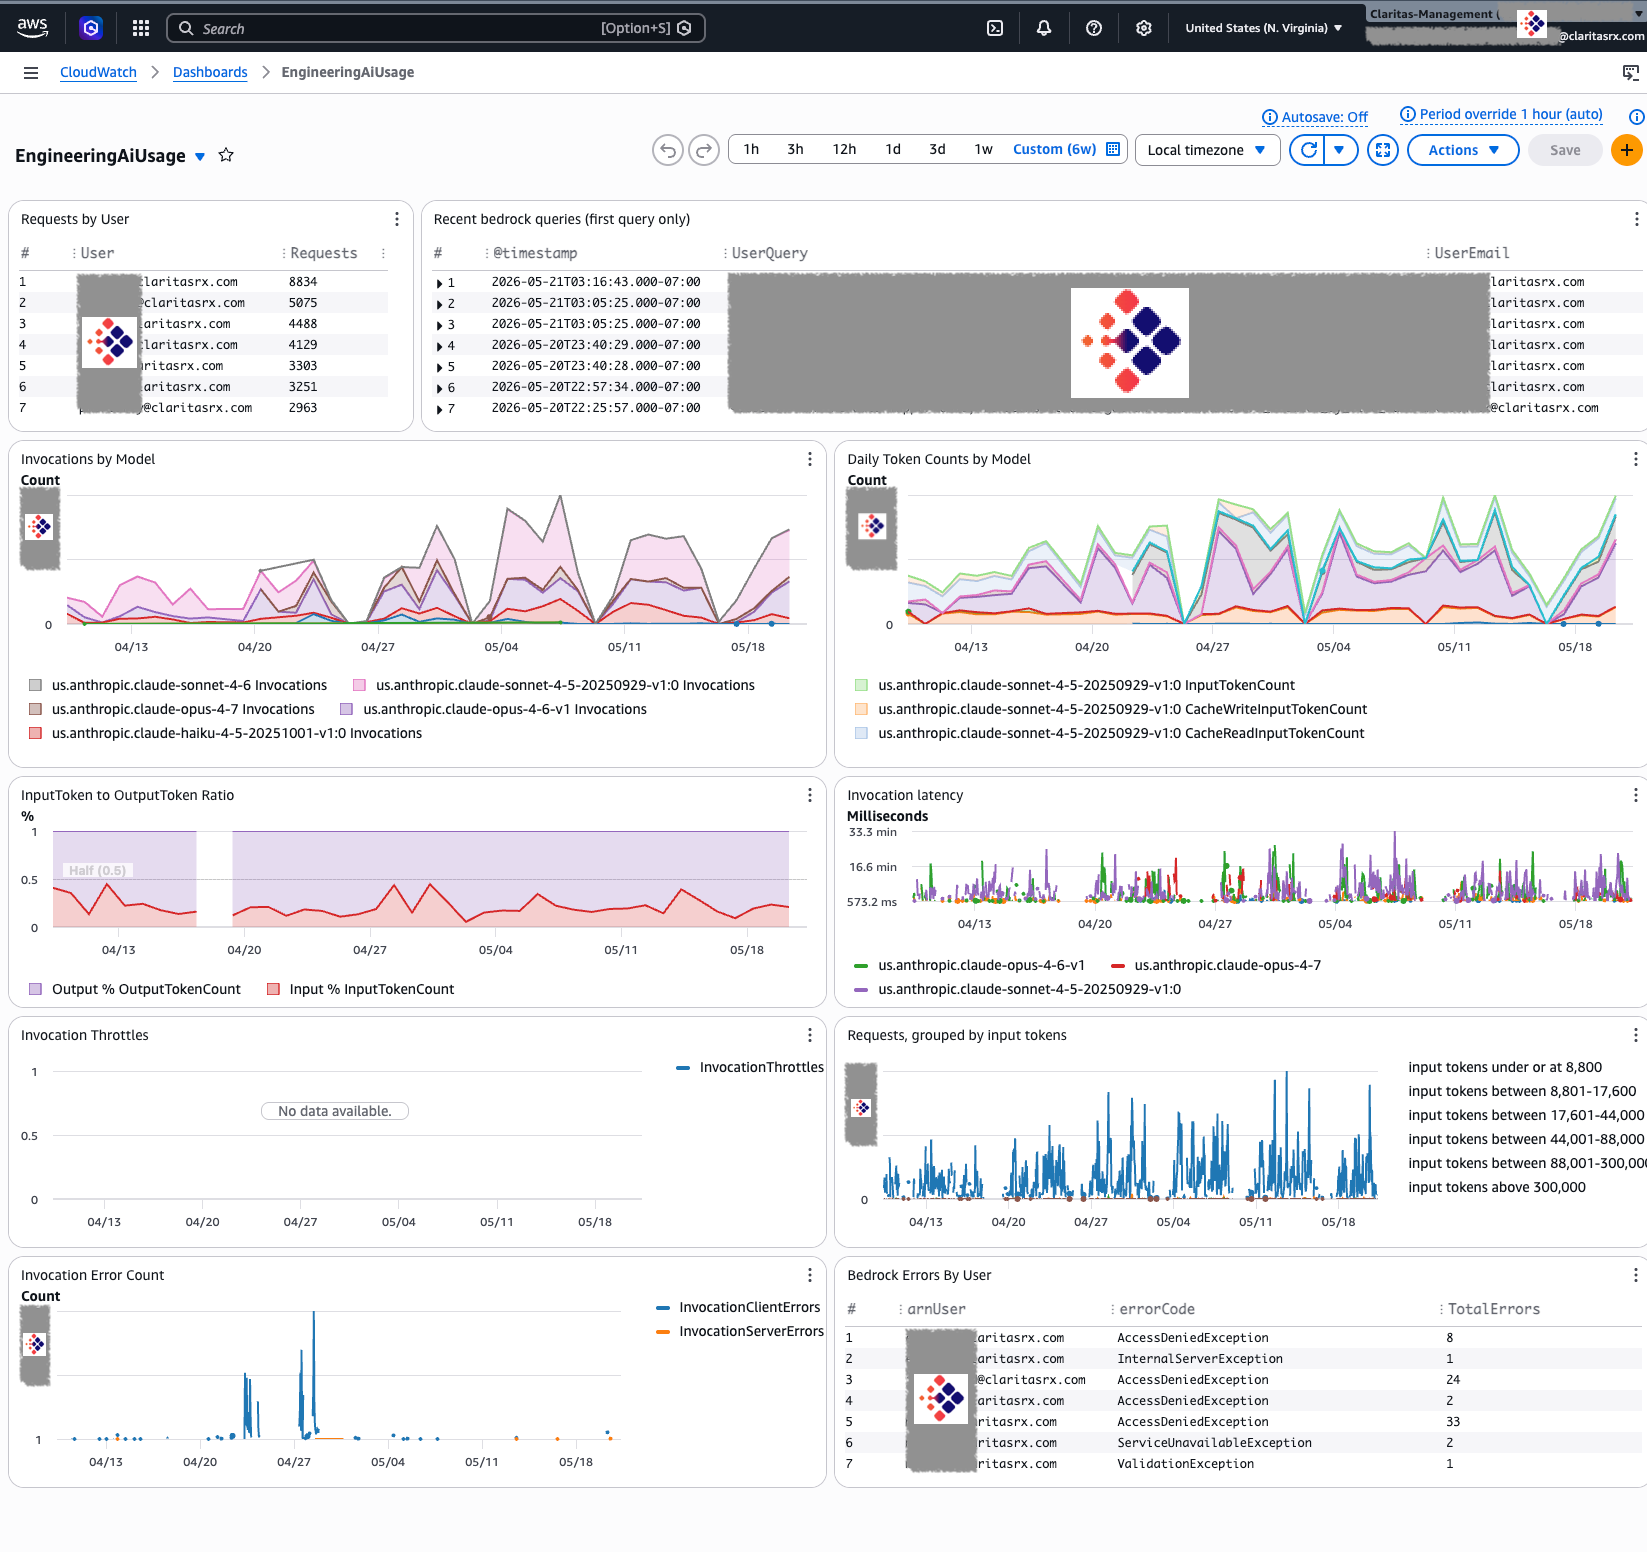
A key design choice: rather than hardcoding model IDs (which change with every model release), use CloudWatch SEARCH expressions to automatically discover all models producing metrics. The dashboard adapts as you enable new models — no code changes required.
import { Duration } from 'aws-cdk-lib';
import {
  Dashboard,
  GraphWidget,
  GraphWidgetView,
  LogQueryVisualizationType,
  LogQueryWidget,
  MathExpression,
  Metric
} from 'aws-cdk-lib/aws-cloudwatch';

const logGroupName = '/aws/bedrock/modelinvocations/production';

const dashboard = new Dashboard(this, 'BedrockUsageDashboard', {
  dashboardName: 'BedrockUsage-production'
});

// Per-user request counts from invocation logs
dashboard.addWidgets(
  new LogQueryWidget({
    title: 'Requests by User',
    logGroupNames: [logGroupName],
    view: LogQueryVisualizationType.TABLE,
    queryLines: [
      'parse identity.arn /.*\\/(?<User>.+)/',
      'stats count(*) as Requests by User',
      'sort Requests desc'
    ],
    width: 6,
    height: 5
  })
);

// Daily invocations by model — SEARCH auto-discovers all active models
dashboard.addWidgets(
  new GraphWidget({
    title: 'Invocations by Model',
    left: [
      new MathExpression({
        expression: "SEARCH('{AWS/Bedrock,ModelId} MetricName=Invocations', 'Sum', 86400)",
        label: 'Invocations',
        period: Duration.days(1)
      })
    ],
    view: GraphWidgetView.TIME_SERIES,
    stacked: true,
    period: Duration.days(1),
    width: 12,
    height: 7
  })
);

// P99 latency by model — surfaces slow outliers per model
dashboard.addWidgets(
  new GraphWidget({
    title: 'Invocation latency',
    left: [
      new MathExpression({
        expression: "SEARCH('{AWS/Bedrock,ModelId} MetricName=InvocationLatency', 'p99', 3600)",
        period: Duration.hours(1)
      })
    ],
    view: GraphWidgetView.TIME_SERIES,
    stacked: false,
    period: Duration.hours(1),
    width: 12,
    height: 5
  })
);

// Input token distribution — shows prompt size patterns
const baseMetric = new Metric({
  namespace: 'AWS/Bedrock',
  metricName: 'InputTokenCount'
});
const sampleCount = baseMetric.with({ statistic: 'SampleCount' });

dashboard.addWidgets(
  new GraphWidget({
    title: 'Requests, grouped by input tokens',
    left: [
      { stat: 'PR(:8800)', label: '≤8,800 tokens' },
      { stat: 'PR(8800:17600)', label: '8,801–17,600' },
      { stat: 'PR(17600:44000)', label: '17,601–44,000' },
      { stat: 'PR(44000:88000)', label: '44,001–88,000' },
      { stat: 'PR(88000:300000)', label: '88,001–300,000' },
      { stat: 'PR(300000:)', label: '>300,000 tokens' }
    ].map(({ stat, label }, i) =>
      new MathExpression({
        expression: `m${i}*total/100`,
        usingMetrics: {
          [`m${i}`]: baseMetric.with({ statistic: stat }),
          total: sampleCount
        },
        label
      })
    ),
    view: GraphWidgetView.TIME_SERIES,
    leftYAxis: { showUnits: false },
    width: 12,
    height: 5
  })
);
The full dashboard implementation adds token ratio analysis, throttle monitoring, and error attribution — all from the same AWS/Bedrock namespace metrics and invocation log group. Because it uses SEARCH expressions, the dashboard automatically picks up new models as they’re enabled in your account — no maintenance required when Anthropic ships a new model version.
4. Developer Configuration
Each developer’s Claude Code session points to Bedrock instead of the public API:
{
  "env": {
    "CLAUDE_CODE_USE_BEDROCK": "1",
    "AWS_REGION": "us-east-1",
    "AWS_PROFILE": "your-org-profile"
  }
}
Developers authenticate via aws sso login, and Claude Code seamlessly routes requests through Bedrock.3 The developer experience is unchanged — same prompts, same models, same quality — but every interaction is now logged and governed inside your AWS account.
Measuring Success: Metrics That Matter
The point of standing this up is not just to satisfy a policy review — it’s to give engineering, finance, and compliance leadership a shared, evidence-based view of what AI is doing inside the org. Within 30 days of enabling Bedrock logging, you should be able to populate a baseline dashboard along three dimensions. The numbers below are illustrative of what a 50-developer organization might see; your actuals will differ.
Adoption metrics (per-user attribution, model and team breakdowns):
- Active developers and invocations per developer per month
- Adoption concentration across teams (e.g., data engineering vs. platform vs. analytics)
- Trend of total invocations over time
Cost metrics (from AWS Cost Explorer + invocation logs):
- Monthly Bedrock spend, by team and by model
- Mix of model tiers (Haiku / Sonnet / Opus) — useful for surfacing over-use of high-cost models on tasks that don’t need them
- Comparison against other developer tooling line items
Risk metrics (from DLP / pattern scanning over invocation logs):
- Number of prompts flagged for potential sensitive-data patterns
- Percentage of AI usage attributable to authorized, MFA-authenticated users
- Log retention coverage relative to your audit policy
The point isn’t the specific numbers — it’s that, once Bedrock logging is in place, all three views are answerable in your own console rather than requiring a special engineering project for each ask.
What’s Next: Real-Time Telemetry in Part 2
Bedrock self-hosting answers the foundational governance questions: who is using AI, what is it costing, can we prove compliance, can we replay an agent’s decisions? It’s the right floor — durable, auditable, in-your-account logging that supports HIPAA and SOC 2 evidence requirements.
But Bedrock logs are batch-oriented and AWS-bounded. They tell you what happened on the inference side; they don’t tell you what happened in the developer’s terminal — which tools fired, which were rejected, how long sessions ran, what the agent loop actually looked like end-to-end. And they only cover the workloads that route through Bedrock.
Part 2 of this series covers the next layer: real-time telemetry from Claude Code itself, shipped directly to an OpenTelemetry (OTel) collector. Claude Code has native OTel support — metrics, logs, and traces (with distributed tracing linking each user prompt to the API requests and tool executions it triggered).11 Managed settings can be deployed to every developer’s machine via MDM (Jamf, Intune, Workspace ONE) so telemetry is on by default and configured consistently across the fleet.
We’ll walk through:
- Distributing managed Claude Code settings via Jamf and other MDM platforms so every developer machine ships telemetry to your central OTel collector automatically
- The same telemetry pipeline serving two audiences: humans running Claude Code locally for personal productivity, and agentic systems running headless (CI/CD, scheduled jobs, autonomous workflows) for team productivity and larger managed AI builds
- OTLP collector → Prometheus / Loki / your existing observability backend, joining Claude Code telemetry with the rest of your engineering signals (CI builds, deploys, incidents)
- Span-level traces of agent execution: every user prompt linked to the API requests and tool executions it triggered, so you can see a full agentic run as a single trace
- Real-time cost, latency, and error dashboards — beyond what Bedrock alone exposes
- Combining Bedrock invocation logs (the model’s view) with Claude Code OTel (the client’s view) for end-to-end agent observability
Bedrock logging gives you the durable audit floor. Claude Code OTel gives you the real-time operational ceiling. Together, they cover both regulated audit needs and day-to-day engineering visibility — for individual developers and for the agentic systems your platform team is starting to run in production.
Getting Started Today
Your developers are using AI tools whether you’ve sanctioned them or not. The question is whether you’re managing the risk or ignoring it. The good news: for organizations already on AWS, the initial governance posture isn’t a months-long transformation program. The infrastructure can be deployed in a sandbox account in a day, and developer onboarding takes an afternoon. The harder work — DLP tuning, policy authoring, fleet rollout — builds incrementally from there.
The path forward:
- Audit current state. Survey your engineering teams. Who’s using Claude Code, GitHub Copilot, or other AI tools? How are they authenticating?
- Deploy Bedrock logging. Use the CDK patterns outlined here (or AWS’s reference implementation) to stand up logging infrastructure in a sandbox AWS account.12
- Pilot with a single team. Onboard your platform or data engineering team first. Validate logging, test IAM policies, establish baseline metrics.
- Expand and govern. Roll out to additional teams, implement budget alerts, train leaders on CloudWatch Insights queries.
- Build toward Part 2. Once Bedrock logging is established, begin planning your OTel collector and managed Claude Code settings rollout.
The competitive advantage isn’t just using AI tools — it’s using them responsibly, at scale, with confidence. That confidence begins with visibility. And visibility begins with taking control.
In Part 2 of this series, we’ll dive into real-time Claude Code telemetry: deploying OTel-enabled managed settings via MDM, building a unified observability pipeline for both human-in-the-loop developers and autonomous agents, and joining client-side telemetry with Bedrock invocation logs for end-to-end visibility. Subscribe to stay informed as we continue exploring responsible AI adoption for regulated industries.
References
- Anthropic. Access the Compliance API. The Compliance API on the Enterprise plan exposes activity logs, chat histories, and file content; some surfaces (e.g., Cowork) are not yet covered. https://support.claude.com/en/articles/13015708-access-the-compliance-api
- AWS. HIPAA compliance for generative AI solutions on AWS. Amazon Bedrock is on the AWS HIPAA Eligible Services Reference and is covered by the AWS BAA; this coverage does not extend to Anthropic’s public Claude API. https://aws.amazon.com/blogs/industries/hipaa-compliance-for-generative-ai-solutions-on-aws/
- Anthropic. Claude Code on Amazon Bedrock. Setting
CLAUDE_CODE_USE_BEDROCK=1andAWS_REGIONroutes Claude Code through Bedrock;/loginand/logoutare disabled because authentication uses AWS credentials. https://code.claude.com/docs/en/amazon-bedrock - AWS. Amazon Bedrock — Security and Compliance. Model providers (including Anthropic) do not have access to customer prompts, responses, or Bedrock logs. https://aws.amazon.com/bedrock/security-compliance/
- AWS. Use interface VPC endpoints (AWS PrivateLink) with Amazon Bedrock. Interface endpoints for the
bedrockandbedrock-runtimeservices keep traffic off the public internet. https://docs.aws.amazon.com/bedrock/latest/userguide/vpc-interface-endpoints.html - AWS. Monitor model invocation using CloudWatch Logs and Amazon S3. Model invocation logging is disabled by default and can be enabled to deliver full request/response/metadata to CloudWatch Logs, S3, or both. https://docs.aws.amazon.com/bedrock/latest/userguide/model-invocation-logging.html
- AWS. Amazon CloudWatch — Model Invocations. Automatic dashboards expose an invocation table and a “View in Logs Insights” path to the underlying prompt/response. https://docs.aws.amazon.com/AmazonCloudWatch/latest/monitoring/model-invocations.html
- AICPA. SOC 2 Trust Services Criteria — CC7 (System Operations). CC7.1–CC7.5 govern detection, evaluation, and response to security events, including monitoring and incident response evidence.
- U.S. Department of Health & Human Services. 45 CFR §164.312(b) — Audit controls. Covered entities must implement mechanisms that record and examine activity in systems that contain or use ePHI. https://www.ecfr.gov/current/title-45/subtitle-A/subchapter-C/part-164/subpart-C/section-164.312
- AWS Prescriptive Guidance. Configure model invocation logging in Amazon Bedrock by using AWS CloudFormation. Documents the Lambda-backed Custom Resource pattern for enabling invocation logging from CloudFormation. https://docs.aws.amazon.com/prescriptive-guidance/latest/patterns/configure-bedrock-invocation-logging-cloudformation.html
- Anthropic. Claude Code — Monitoring usage. Native OpenTelemetry support exposes metrics, logs, and distributed traces; prompt content and tool arguments are not collected by default and require explicit opt-in. https://code.claude.com/docs/en/monitoring-usage
- AWS Solutions. Guidance for Claude Code with Amazon Bedrock. Reference implementation and architectural guidance for enterprise Claude Code deployments on Bedrock. https://aws.amazon.com/solutions/guidance/claude-code-with-amazon-bedrock/